
Data Analysis in Excel Level 3 Course
Many professionals use Excel daily yet never fully understand its analytical power. Enrol today to strengthen your data awareness, reduce decision-making uncertainty, and avoid relying on assumptions when clarity is expected.
4.6
(7 Reviews) 57 Students

Data Analysis in Excel Level 3 Course
Exclusive Deal! 94% Off, Today Only!
Sale Ends In

 TAKE All courses for
£99
TAKE All courses for
£99 


This course includes:
-
 Access1 Year Access
 -
 Skill Level
 -
 Duration2 weeks, 2 days
 -
 Students57 Students
- Original price was: £425.£25Current price is: £25. ex VAT
- 1 year
- Level 3
- Number of Units33
- Number of Quizzes0
- 2 weeks, 2 days Gift this course
 14-Day Money-Back Guarantee
Course Overview
Data-driven decision-making is now an expectation across many UK industries, yet gaps in analytical understanding continue to limit confidence and accuracy. When spreadsheet data is misinterpreted or poorly structured, small errors can quietly influence reporting, forecasting, and strategic judgment. This course supports learners seeking stronger analytical awareness before such issues affect credibility.
The course explores recognised Excel-based data analysis concepts, including worksheet organisation, list management, data evaluation, visualisation techniques, and the use of PivotTables and charts. You will also examine lookup functions, formula auditing principles, multi-workbook structures, automation concepts, and forecasting approaches. Each topic is presented conceptually, supporting clearer interpretation rather than task-based execution.
By completing this Level 3 course, you will hold a more structured understanding of how Excel supports analytical thinking and informed decision-making. Many professionals later recognise they relied on spreadsheets without fully understanding them—strengthen your knowledge now and remain aligned with evolving workplace expectations.
Learning Outcomes
- Explain lookup function logic and its relevance to accurate data referencing.
- Explain the purpose of PivotTables in summarising complex datasets effectively.
- Understand forecasting principles used to interpret potential future data trends.
- Understand how charts support meaningful visual representation of analysed data.
- Understand principles for modifying worksheets to support structured data analysis.
- Explain how organised lists contribute to consistent and reliable data interpretation.
- Explain automation concepts that support consistent workbook functionality awareness.
- Understand how multiple worksheets and workbooks support integrated data structures.
- Understand formula auditing principles used to identify potential calculation inconsistencies.
Why People Love and Enrol in this Training?
- CPD Accredited Course
- Unlimited access for 12 months – learn at your own pace ️
- Earn instant certificate upon course completion
- Get a free student ID card to showcase
- Flexible study – no deadlines
- Transparent pricing – no hidden fees
- Dedicated tutor support on weekdays
- Fast assessments & instant results
Who is this Course For?
- Career-focused Excel learners
- Project support team members
- Business and office professionals
- Data-focused administrative staff
- Finance and accounts personnel
- Reporting and information officers
Certificate of Achievement

CPD Certification
After completing the MCQ assessment, you will qualify for the CPD Certificate from HF Online as proof of your continued professional development. You can order your certificate at a cost of £10 for PDF and £29 for hard copy certificate or both for £39.
Assessment
For assessing your learning, you have to complete an automated MCQ exam. It is required for the students to score at least 60% to pass the exam. Learners can apply for the certificate after they clear the exam.
There are assignment questions provided at the end of the course. You are suggested to complete the questions to enrich your understanding of the course. You can complete this according to your preferred time. The expert tutor will provide feedback on your performance after assessing your assignment.
Prerequisites
There are no prerequisites and you may use any internet-enabled device to study at your own speed, it is adaptable and available to students of all skill levels.
Job Opportunities
Developing structured knowledge of Excel-based data analysis supports informed decision-making across administrative, analytical, and reporting-focused roles. This course aligns with UK organisations that rely on data interpretation, accuracy, and structured reporting standards.
- Data Administrator
Data Administrators support the organisation, maintenance, and interpretation of spreadsheet information across departments. Their role supports accuracy, consistency, and reliable reporting. Average salary £24,000–£32,000 - Business Support Analyst
Business Support Analysts assist teams by reviewing data trends and supporting internal reporting processes. Their understanding of Excel analysis supports operational insight. Average salary £28,000–£38,000 - Finance Assistant
Finance Assistants support budgeting, reporting, and financial data interpretation activities. Analytical spreadsheet knowledge supports accuracy and compliance. Average salary £25,000–£35,000 - Project Support Officer
Project Support Officers assist with monitoring timelines, budgets, and performance data. Structured Excel understanding supports informed project oversight. Average salary £27,000–£37,000 - Reporting Coordinator
Reporting Coordinators manage data summaries and structured reports for internal stakeholders. Their role supports clarity and consistency in organisational reporting. Average salary £30,000–£40,000 - Operations Analyst
Operations Analysts review performance data to support planning and efficiency insights. Spreadsheet analysis knowledge supports informed operational decisions. Average salary £32,000–£45,000 - Office Systems Coordinator
Office Systems Coordinators oversee spreadsheet structures and data consistency across teams. Their role supports efficient information management. Average salary £26,000–£36,000 - Accounts Data Officer
Accounts Data Officers support financial record analysis and data verification processes. Excel knowledge underpins accuracy and audit readiness. Average salary £28,000–£38,000 - Management Information Assistant
Management Information Assistants support the preparation and review of performance data for leadership teams. Their role contributes to evidence-based reporting. Average salary £29,000–£39,000 - Junior Data Analyst
Junior Data Analysts support data interpretation tasks under supervision within structured environments. Their knowledge supports analytical accuracy and insight development. Average salary £30,000–£42,000
Course Curriculum
| Modifying a Worksheet | |||
| Insert, Delete, and Adjust Cells, Columns, and Rows | 00:10:00 | ||
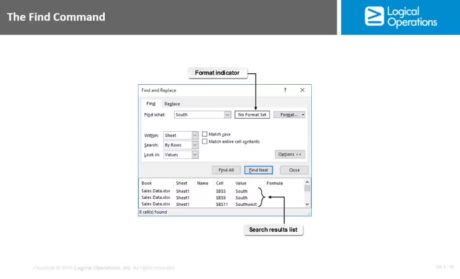
| Search for and Replace Data | 00:09:00 | ||
| Use Proofing and Research Tools | 00:07:00 | ||
| Working with Lists | |||
| Sort Data | 00:10:00 | ||
| Filter Data | 00:10:00 | ||
| Query Data with Database Functions | 00:09:00 | ||
| Outline and Subtotal Data | 00:09:00 | ||
| Analyzing Data | |||
| Apply Intermediate Conditional Formatting | 00:07:00 | ||
| Apply Advanced Conditional Formatting | 00:05:00 | ||
| Visualizing Data with Charts | |||
| Create Charts | 00:13:00 | ||
| Modify and Format Charts | 00:12:00 | ||
| Use Advanced Chart Features | 00:12:00 | ||
| Using PivotTables and PivotCharts | |||
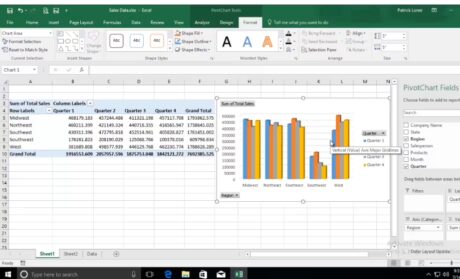
| Create a PivotTable | 00:13:00 | ||
| Analyze PivotTable Data | 00:12:00 | ||
| Present Data with PivotCharts | 00:07:00 | ||
| Filter Data by Using Timelines and Slicers | 00:11:00 | ||
| Working with Multiple Worksheets and Workbooks | |||
| Use Links and External References | 00:12:00 | ||
| Use 3-D References | 00:06:00 | ||
| Consolidate Data | 00:05:00 | ||
| Using Lookup Functions and Formula Auditing | |||
| Use Lookup Functions | 00:12:00 | ||
| Trace Cells | 00:09:00 | ||
| Watch and Evaluate Formulas | 00:08:00 | ||
| Automating Workbook Functionality | |||
| Apply Data Validation | 00:13:00 | ||
| Search for Invalid Data and Formulas with Errors | 00:04:00 | ||
| Work with Macros | 00:18:00 | ||
| Creating Sparklines and Mapping Data | |||
| Create Sparklines | 00:07:00 | ||
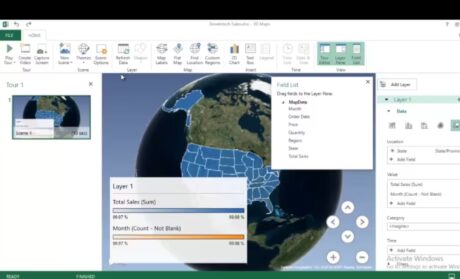
| MapData | 00:07:00 | ||
| Forecasting Data | |||
| Determine Potential Outcomes Using Data Tables | 00:08:00 | ||
| Determine Potential Outcomes Using Scenarios | 00:09:00 | ||
| Use the Goal Seek Feature | 00:04:00 | ||
| Forecasting Data Trends | 00:05:00 | ||
| Assignment | |||
| Assignment – Data Analysis In Excel | 6 days, 14 hours | ||
| Recommended Materials | |||
| Workbook – Data Analysis in Excel | 1 week, 2 days | ||